


Housing Struggles Not Mirrored By Markets
**3RD PARTY INSTITUTIONAL RESEARCH, FINOMGROUP.COM EXCLUSIVE** - A FINANCIAL MARKET RESOURCE FOR THE EVERY-DAY INVESTOR AND TRADER.


The Leuthold Group
The Major Trend Index was unchanged at a High Neutral reading of +1 in the week ended November 22nd, and its four factor categories held steady at their recent levels. After a minor reduction in our tactical portfolios’ equity hedge in early November, those accounts are positioned with net equity exposure of 58%.
The song remains the same: The stock market continues to perform better than the monetary and economic evidence would historically suggest. Despite its improvement, the Cyclical category, which tries to identify and measure that evidence, remains mildly negative at -1. Either that work has missed something, or the stock market is in a mania that’s disconnected from the fundamentals. More likely, it’s a combination of both. What we have probably underestimated is the extent to which massive deficit spending has been a short-term stimulant for economic growth, and financing of those deficits with extremely short-term securities (Treasury bills) has been a short-term intoxicant to market liquidity.
While our Cyclical composite failed to fully capture these short-term fiscal boosts, they’ve not gone unnoticed by our Technical work: That category now scores at a bullish +4, and has not dipped below +3 since early-December 2023. Furthermore, at least for now, stock market internals look better than the “World’s Reserve Index”TM (aka the S&P 500). All of our usual bellwethers* closed at bull market highs during the two weeks following the November 11th all-time S&P 500 high. It’s pretty rare to see this sort of reverse divergence (in which the “general” lags the movements of the “troops”), but we won’t consider it problematic unless the condition lasts for at least a few more weeks.
The S&P 500 trades north of all of the “bubble” valuation thresholds we suggested earlier this year but—based on an average of those measures—it is still 5-6% below levels reached at the Y2K Technology peak. A break above 6,450 in the S&P 500 would earn this stock market distinction as the priciest one of all time. That fact alone suggests even the most nimble of tactical managers should be positioned below their equity exposure maximums.
As noted, the S&P 500 has emerged as a short-term laggard relative to the bellwethers we’d expect to forewarn of a top in that very index. It’s an internal condition so rare that we wanted to capture it before it’s erased by a new S&P 500 high. But it’s also a sign that July’s leadership inflections (Growth to Value, Large Cap to Small Cap) are continuing, albeit in fits and starts.

The most important of the latest highs was the one recorded yesterday in the NYSE Daily Advance/Decline Line (its prior high was October 18th). Historically, this event has “reset the clock” on the eventual bull market peak. Since 1956, there’s been a median lag time of 30 weeks between the peak in NYSE Breadth and the final top in the S&P 500. However, during this “distribution” phase, the index gain has usually been fairly muted (median of +5.6%). Outside of the COVID market peak, there’s been only one other instance in which the A/D Line failed to turn lower prior to an S&P 500 bull market peak.

While S&P 500 valuations are closing in on the bubble extremes of early 2000, we’d agree that today’s investor psychology is not as euphoric as it was at the pinnacle of that mania. This may be partly because the S&P 500 gain in 2024 has been pretty well balanced from a fundamental perspective:
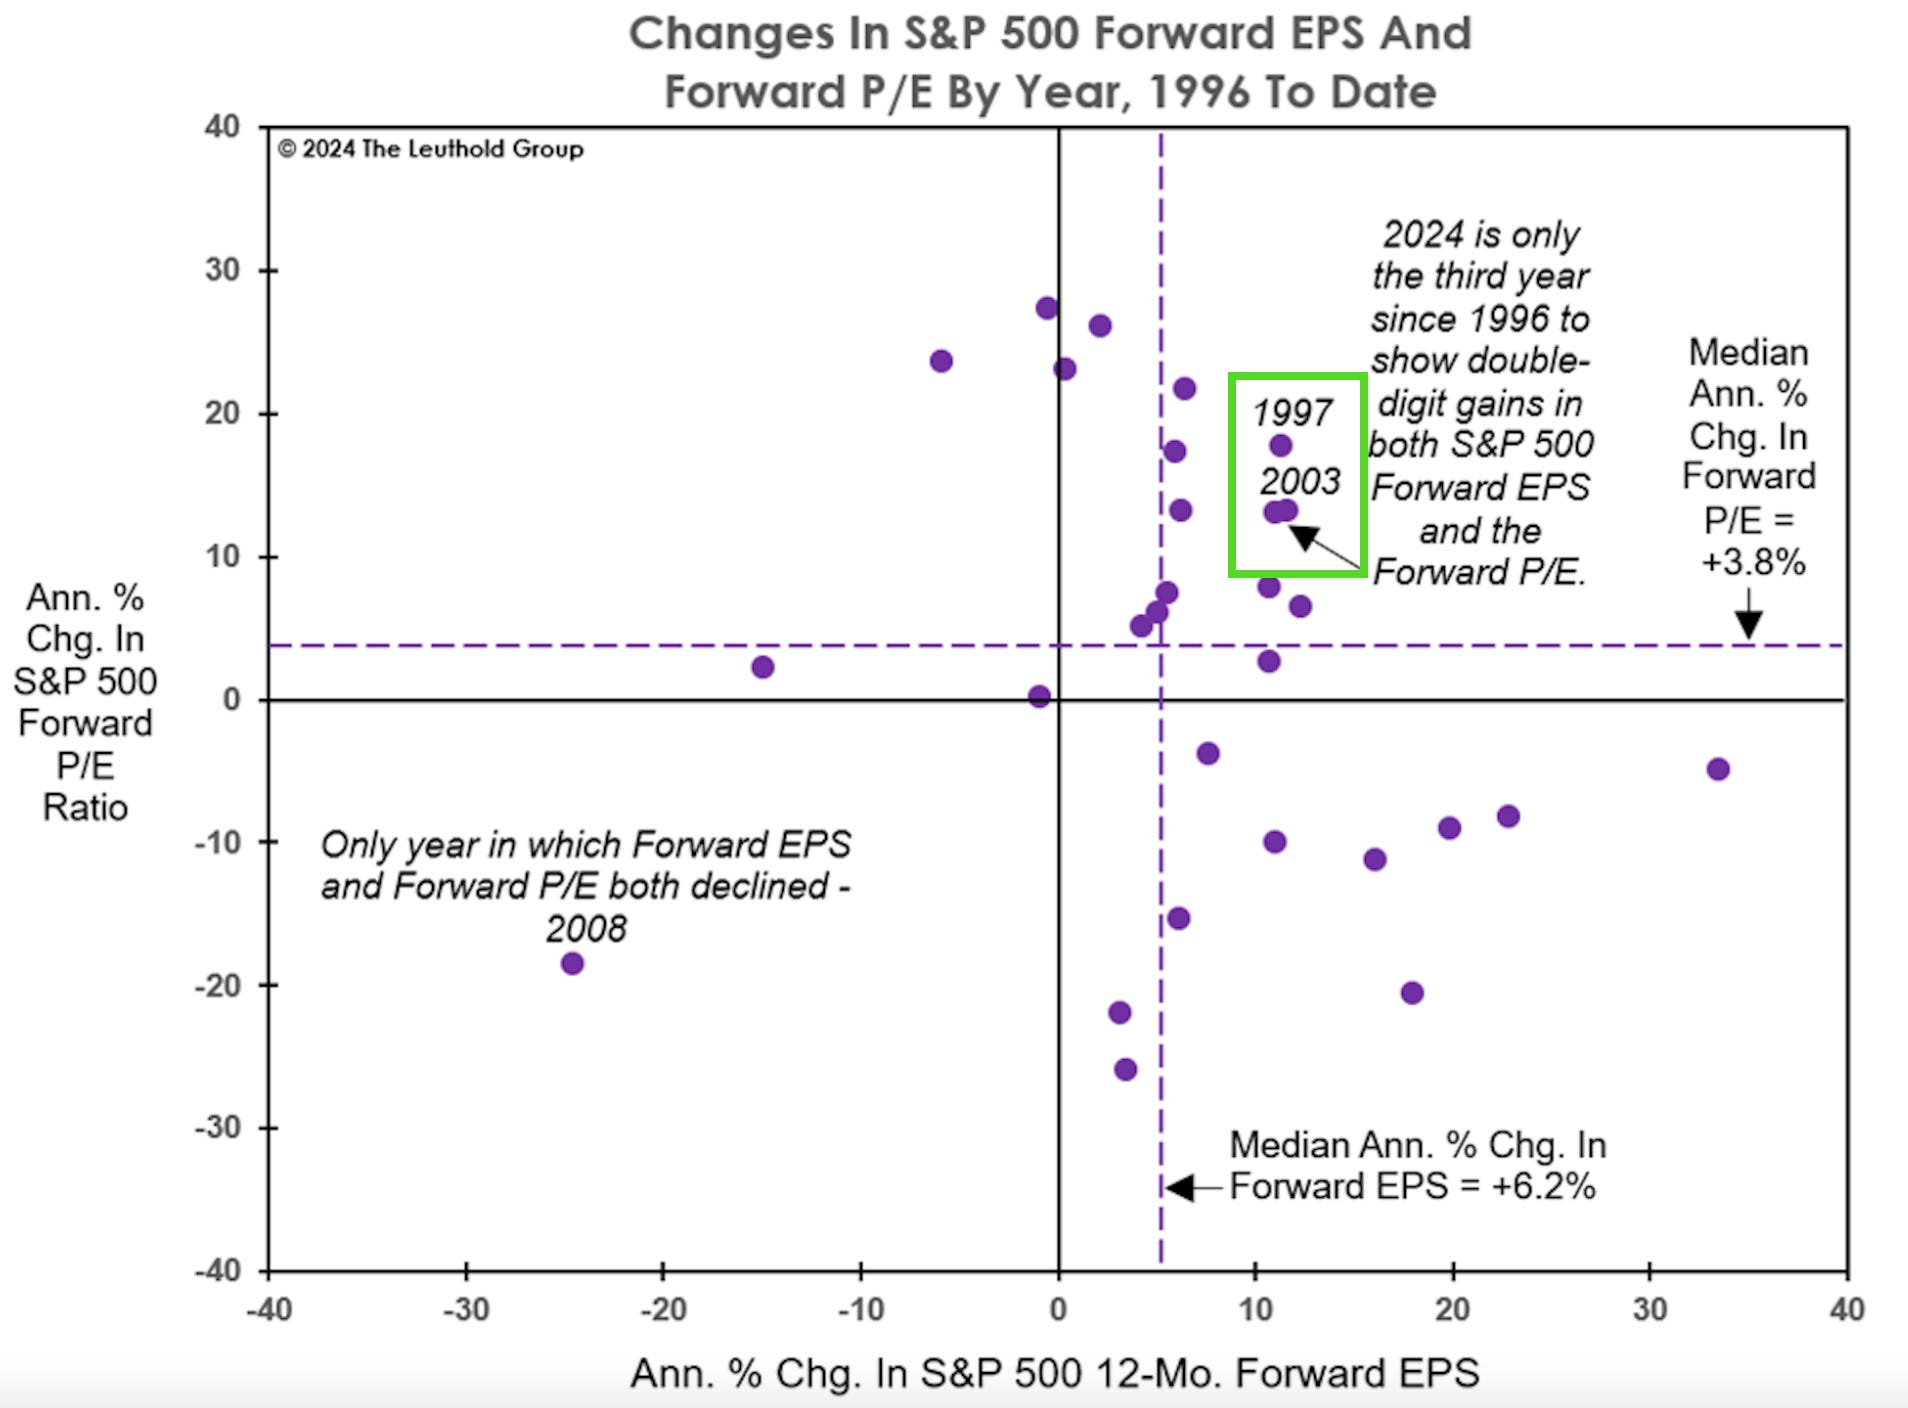
Year-to-date, S&P 500 12-Mo. Forward EPS (per FactSet) are up 11.1%. If the rate of increase observed over the last several weeks continues through December, there’s a good chance the full-year result will be twice the long-term median of 6.2%.
Meanwhile, the S&P 500 Forward P/E multiple of 22.1x is up 12.7% from its year-end 2023 reading of 19.6x. (Readings above 21.0x haven’t been observed outside of 1998-2001 and 2020-2022.)
Unless, there’s a sharp reversal in these series, 2024 will be just the third time in the last 29 years when Forward EPS and the Forward P/E ratio have both increased by double-digit amounts in a calendar year. We’ll let the bulls savor this embarrassment of riches while they can.
Finom on October’s Housing Data Series
We suspect that both hurricanes, as well as mortgage rates, somewhat distorted all of the housing reports for October. Recently reported, with existing home sales we analyzed that while sales remained rangebound, price appreciation increased and the pace of inventory accumulation decreased.
There was something of a mirror image in Tuesday’s reports on both new and repeat home sales. In the case of new homes, sales decreased sharply while inventory increased sharply. And price appreciation accelerated for both new and repeat home sales, but it may be unresolved seasonality at work.
New home sales data are very noisy and heavily revised from one month to the next, so we must not overreact to a singular monthly data set. With that out of the way, the next thing to consider is that mortgage rates have risen back close to 7%, which has proven to sustain the bear market in housing transactions, even if not in prices.

While an increase from 6% to 7% doesn’t seem like much, that increases the necessary monthly payment by about 10%, which is enough to drive many people to the sidelines, and that is what we have seen with purchase mortgage applications, which have fallen back down close to their post-pandemic lows.Having said that, however, there has been a more recent decline in the mortgage rate, but it hasn’t proven a trend given the rapid rise in the 10-Year Treasury yield.
In any event, between mortgage rates, hurricanes, and noise, new home sales (blue in the graph below) declined to 610,000 annualized, the lowest rate since November of 2022. The flip side of that was that the inventory of new homes for sale increased sharply to a new post-pandemic high (gold):

The latter is actually “good” news because recessions have in the past happened after not just sales decline, but the inventory of new homes for sale also decline. In other words, probably the anomaly will be reversed in the next month or two, although this is not a prediction but rather that which we’ve witnessed in most every other economic cycle.
The median price of an existing home increased +2.5% last month alone, and are up +4.7% YoY, a reversal of the recent trend:

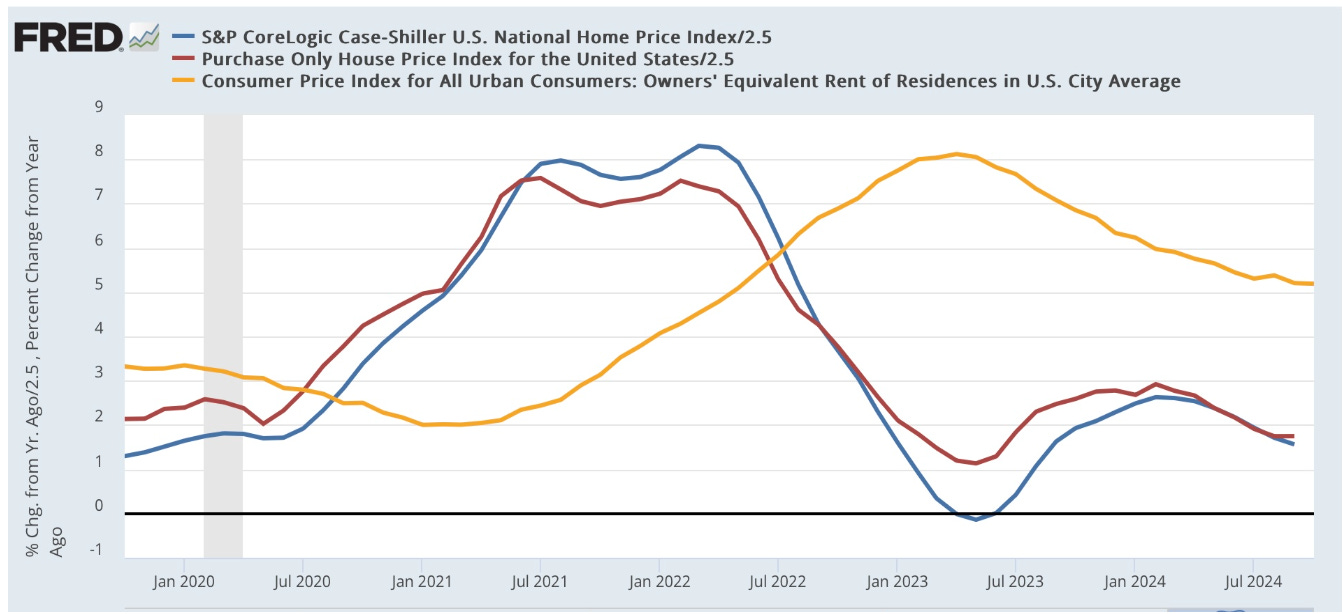
A similar increase occurred in repeat home sales, as on a monthly basis alone prices increased +0.3% in the Case Shiller Index and a whopping +0.7% in the FHFA index. But because there were similar increases last year in October, on a YoY basis the Case Shiller index is only up 3.9%, and the FHFA index up +4.4%, unchanged from a month ago. Since house prices lead the measure of Owners’ Equivalent Rent in the CPI by 12-18 months, this suggests that the shelter component of the CPI should continue to decline gradually in the months ahead:
Beginning with permits and starts, none of the measures of any kind in the housing market had a good month in October. Construction was down, sales were unchanged (existing homes) or down sharply (new single family homes), and prices were up sharply on a monthly basis. This is one period only folks. Single family new home sales in particular are noisy. But if mortgage rates continue in the 7% range, and the housing market turns negative, with manufacturing already having stalled out, the economy is going to be under some degree of pressure as we move into 2025.

On a more encouraging note, “Home purchase sentiment…as measured by Fannie Mae rose 0.7 points to 74.6 in October, its highest level since Feb 2022. 20% of consumers think it’s a good time to buy a home, while the share who think it’s a good time to sell…declined to 64%…[as] a survey high number of consumers expect mortgage rates to fall. The personal finance components remain flat sequentially, with fewer consumers expressing job loss concerns and slightly more indicating that their household income fell YoY. The full index is up 9.7 points year over year.” (BofA Global Research)
We won’t make any judgement calls in this regard, however, until we see the subsequent monthly housing data series, and discover whether or not there are more pressing seasonal factors at play.
Dr. Ed Yardeni
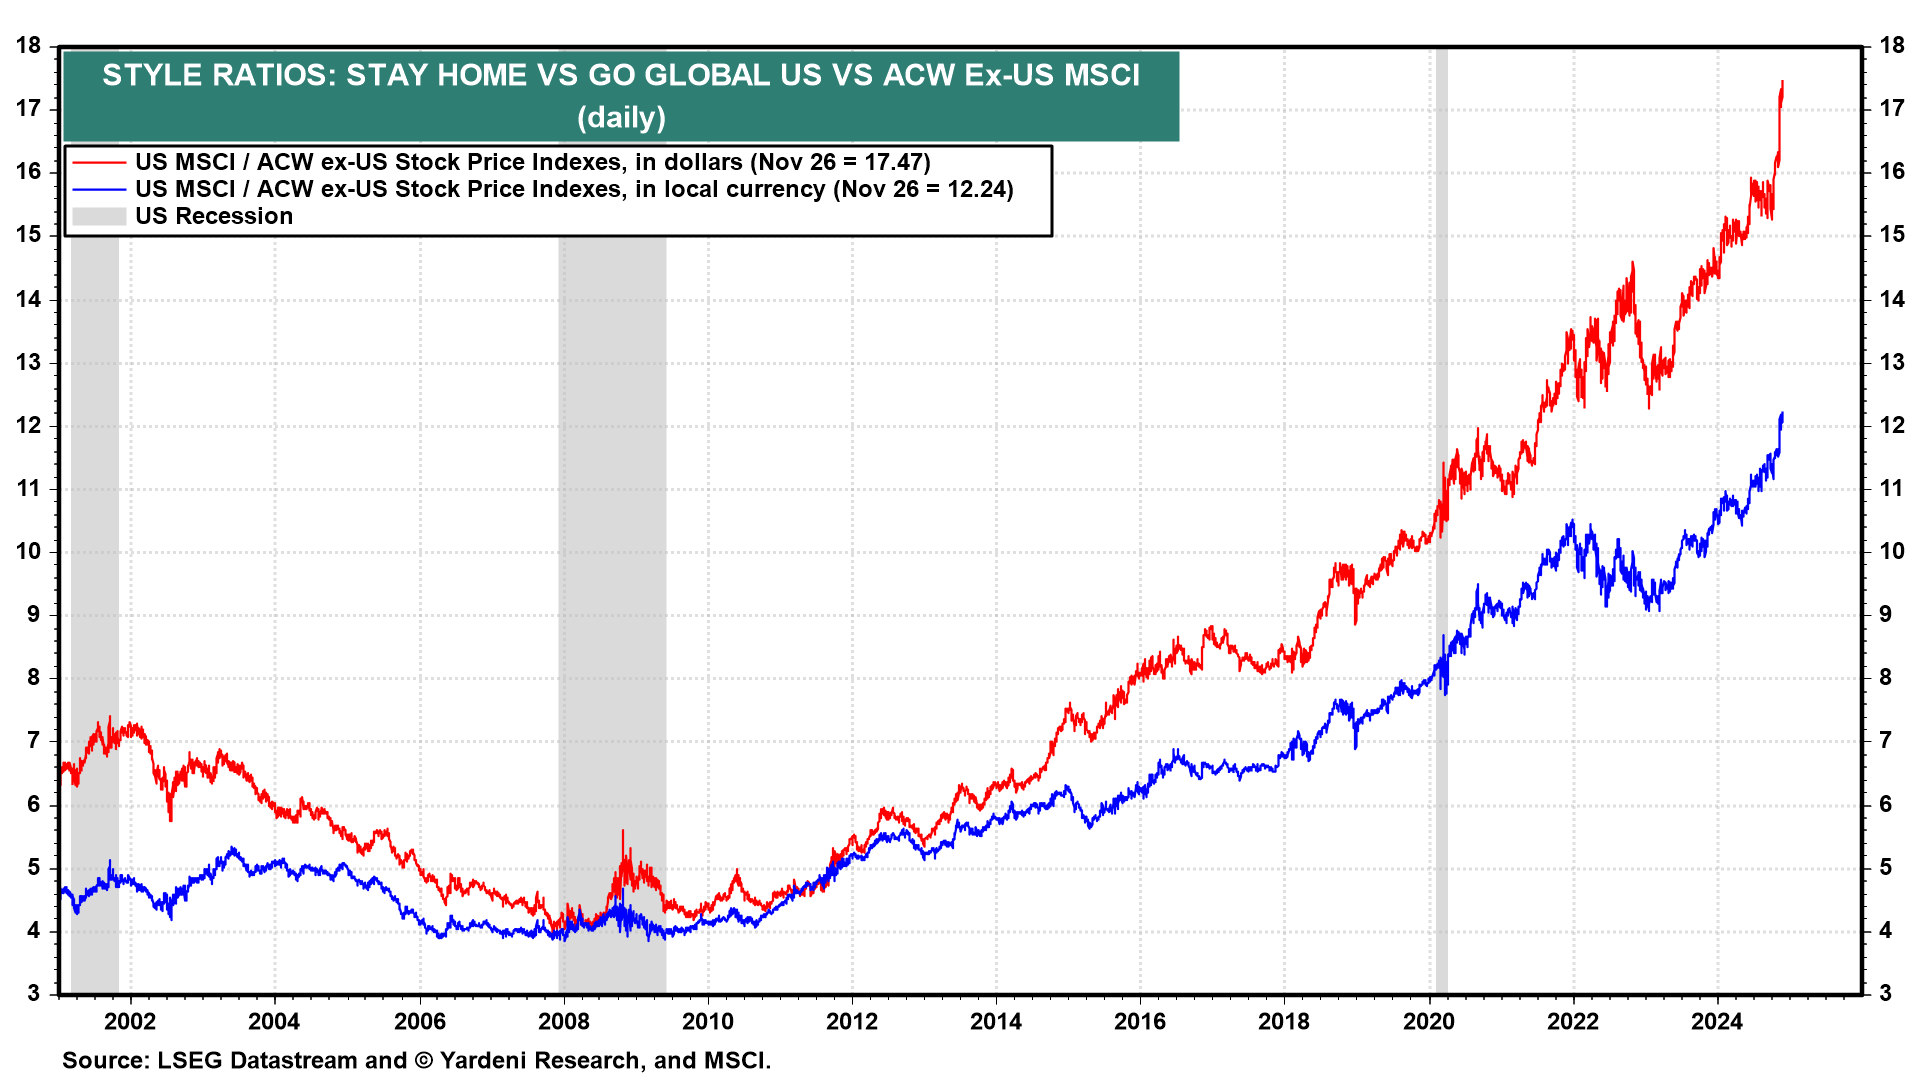
Since 2010, we’ve been recommending a Stay Home investment strategy, i.e., overweighting the U.S. in global equity portfolios, rather than a Go Global strategy. So far, so good (chart).
Nothing in Wednesday’s data deluge changes our positive outlook for the U.S. economy and stock market. Q3’s real GDP was unrevised at 2.8% (saar). Q4’s real GDP is tracking at 2.7%, according to GDPNow. Real incomes are rising to record highs and the labor market is in good shape. Inflation has moderated significantly, but may be stuck above the Fed’s 2.0% target. Let’s dig in:
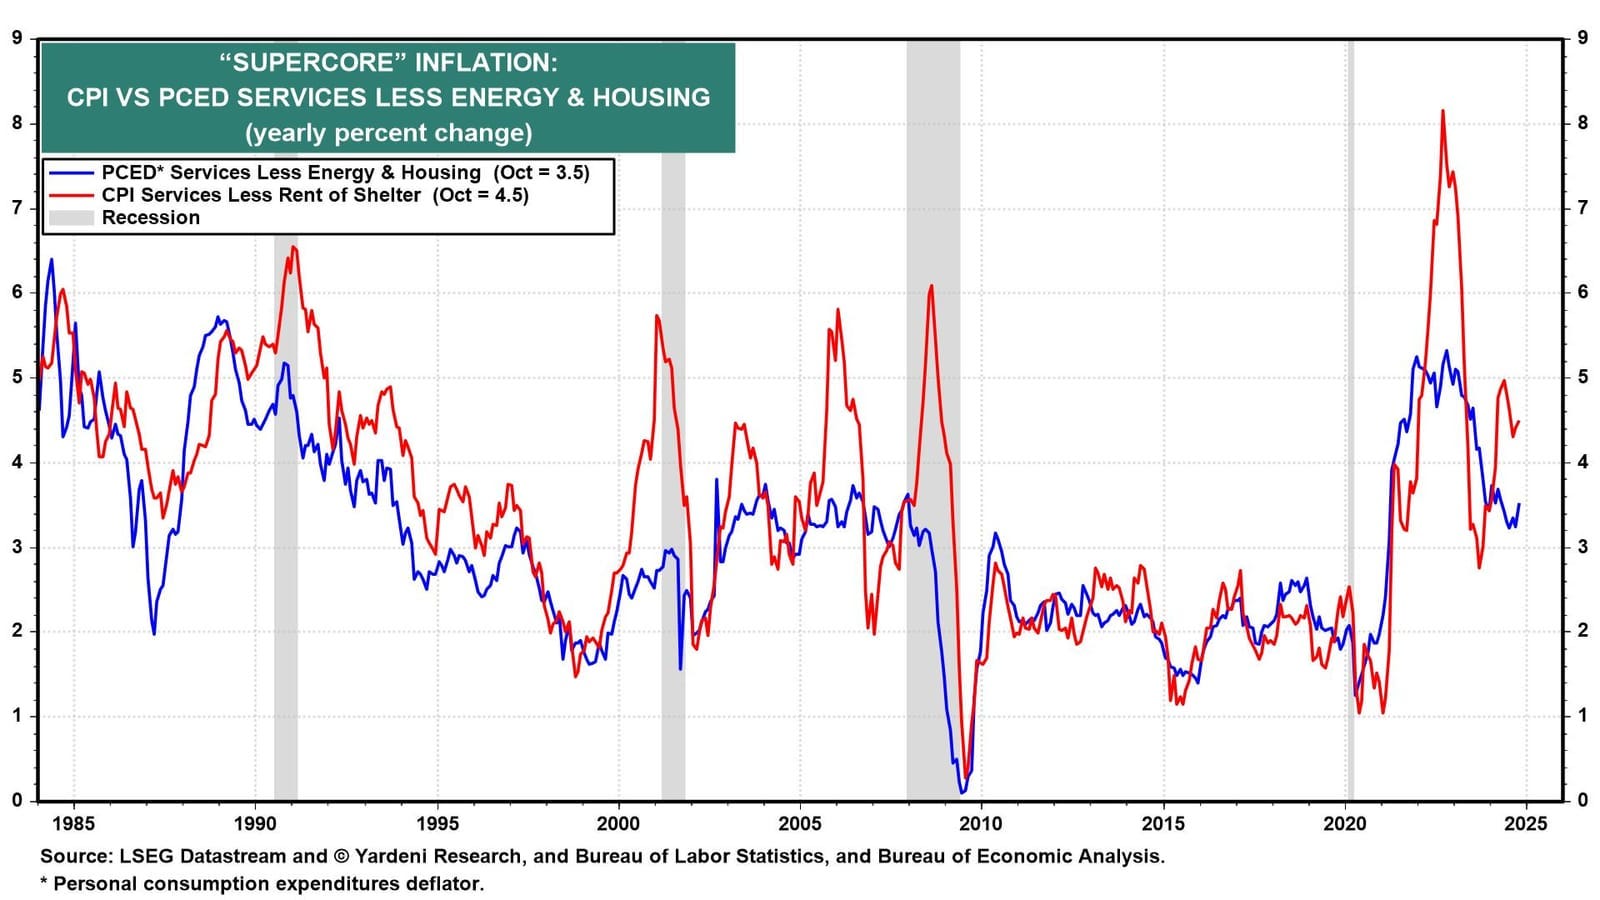
(1) PCED inflation. The Fed’s preferred inflation gauge, core PCED, rose 0.3% m/m and 2.8% y/y in October. That was the same increase on a monthly basis and up from 2.7% y/y in September. However, October’s supercore (core services excluding housing) PCED inflation rose to 3.5% y/y (chart). Two years ago, Fed Chair Jerome Powell said this was the best gauge of underlying inflation. Today, it’s 150bps north of the Fed’s 2.0% target for the overall core PCED. We think that Fed officials will pause their rate cutting. It not, they risk overheating the economy and fueling a stock market meltup.
(2) Personal income & outlays. Real disposable personal income rose 0.4% m/m during October. The 0.1% increase in real personal consumption expenditures in October reflected an increase of less than 0.1% in spending on goods and an increase of 0.2% in spending on services (chart). That was enough to boost GDPNow’s Q4 estimate for real consumption from 2.8% to 3.0%.
Within goods, the largest contributor to the increase was recreational goods and vehicles. Within services, the largest contributor to the increase was health care (both hospitals and outpatient services), followed by food services and accommodation. This pattern is consistent with our view that retired Baby Boomers are spending more on restaurants, travel, and health care.

(3) Corporate profits. Q3’s corporate profits from current production remained close to its Q3 record high. Corporate cash flow rose to a record $3.8 trillion last quarter (chart). Corporations have plenty of cash to finance record capital spending, especially on technology.

(4) Unemployment claims. Initial jobless claims were flat at 213,000 in the week ended November 23. Continuing claims fell by 1,000. There’s still no sign of layoffs as the labor market remains in good shape.
QuantifiablEdges by Rob Hanna
The strong breadth readings over the last few days triggered one of my oldest and most favorite studies. It looks at other times that breadth came in strong for 3 days in a row. I have shown this study many times over the years. I often refer to it as a Triple-70 Thrust, because it requires the NYSE Up Issues % to close at 70% or greater for 3 days in a row. Stats are updated.

There are a lot of positive numbers and the edge generally appears to be to the upside. Results between 70 and 90 days appear especially strong and consistent. Below is the profit curve and stats assuming an 80-day holding period.

The curve and stats remain encouraging. The broad rally we have seen over the last few days appears to be a positive breadth thrust for the intermediate-term.

