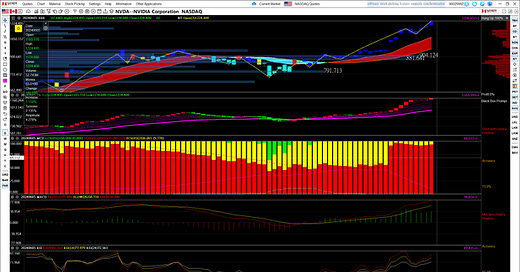
The performance of NVDA stock since the appearance of the red candle on the daily chart and weekly chart when it was $830 and $883 on April 26 and $882-$922 in the week of May 10 has been remarkable. There were moments of skepticism and hesitation, but the red candle, acting as a buy signal, has proven reliable on numerous occasions throughout my three-year charting experience. Whale data has consistently provided accurate insights, unlike the often misleading market noises.
The current support levels for NVDA are at $1158 and $1205, with a significant whale accumulation rate of approximately 93.935%. This high level of whale accumulation, over 93%, is consistent across daily, weekly, monthly, and quarterly charts, indicating strong investor confidence in the stock. Technical indicators such as MACD and RSI are leaning bullish, although RSI (9) is currently in overbought territory at 82.163. Historically, when RSI (9) reached around 87 on March 7 and 86.9 on May 29, the following day NVDA achieved its all-time high at that time, at $974 and $1158 respectively.


